Debugging
ECA processes models in the background in response to events. Because there is no visible output during processing, finding out why a model does not behave as expected requires dedicated debugging tools.
ECA provides three approaches, each suited to different situations:
- Visual debug mode (ECA 3.1+) -- interactive, detailed, built into the modeler UI.
- Database logging -- lightweight, works with every ECA version.
- Webprofiler (ECA 2+) -- per-request isolation of ECA log messages.
Visual debug mode
Requires ECA 3.1 or later and a modeler that supports it. Currently only the Workflow Modeler supports visual debugging.
Visual debug mode collects detailed processing data -- including the full list of available tokens and their values at every step -- and displays the results directly in the modeler UI.
Enable debug mode
There are two ways to activate it:
- Manually
- Go to Administration > Configuration > Workflow > ECA > Settings
(
/admin/config/workflow/eca/settings) and enable the Debug mode checkbox. - Via the test button
- In the Workflow Modeler, click the Test button on an event. This temporarily enables debug mode for the duration of the test. If debug mode was not already on, ECA enables it automatically and disables it again when the test completes or when the configured timeout expires.
Performance impact
Debug mode has a significant performance impact because it normalizes and stores token data on every ECA processing run. Do not leave it enabled on production sites. See Troubleshooting for instructions on disabling it via Drush if the UI is not accessible.
Debug settings
The following settings are available at
Administration > Configuration > Workflow > ECA > Settings or via
drush state:set:
- Debug data depth
- Maximum recursion depth for normalizing token data (default:
5, minimum:2). Higher values expose more detail in nested data structures but increase processing time. - Debug data cases
- Maximum number of history cases stored per event (default:
10, minimum:1). Each case captures one complete processing run. Older cases are discarded when the limit is reached. - Debug test timeout
- Timeout in seconds for test-triggered debug mode (default:
300, i.e. 5 minutes). When the test button auto-enables debug mode and the test is not completed or canceled within this duration, debug mode is automatically disabled. Set to0to disable the timeout.
Using the test button
- Open a model in the Workflow Modeler.
- Click the Test button on an event node.
- Trigger the event (for example, save a node or submit a form).
- The modeler polls for results and displays the processing history, including all tokens and their values at each step.
If you close the browser tab before the test completes, the timeout (default: 5 minutes) ensures debug mode does not stay on indefinitely.
Disabling debug mode from the command line
If debug mode is stuck or the UI is not accessible:
1 | |
See the Troubleshooting page for the full list of debug-related state keys.
Database logging
This method works with all ECA versions and does not require a specific modeler.
Requirements:
- Enable the Database Logging (
dblog) module. - Go to Administration > Configuration > Workflow > ECA > Settings
(
/admin/config/workflow/eca/settings) and set the log level to Debug.
ECA writes detailed messages about every processing step to the database log. Review them at the dedicated ECA log page:
Administration > Configuration > Workflow > ECA > Log
(/admin/config/workflow/eca/log)
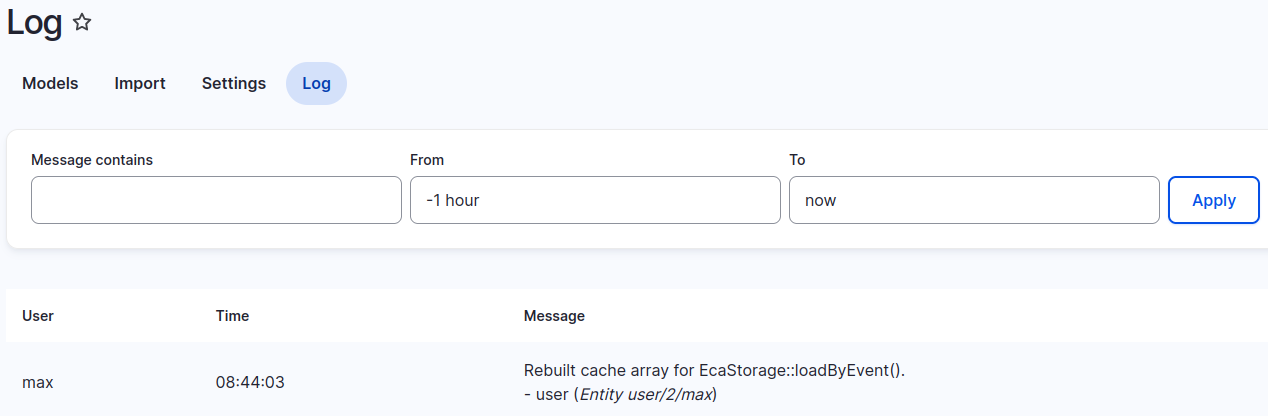
Messages appear in chronological order. Each message describes the processing step and lists the tokens (name and value) available at that point.
Tokens are the key
Most unexpected behavior in ECA models comes from a missing token or a token present under a different name. The token list in each log message tells you exactly what is available at every step.
This approach is straightforward to enable and works well for simple models. For complex setups with many concurrent models, the volume of log messages can make it harder to isolate specific processing runs.
Reset the log level
After debugging, set the ECA log level back to a less verbose setting (for example, Warning or Error). Leaving it at Debug generates a large number of log messages that can affect site performance.
Webprofiler
This method provides per-request isolation of ECA log messages, making it easier to debug specific page requests.
Requirements:
- For ECA 1:
- Install the Webprofiler module:
composer require drupal/webprofiler - Enable the Webprofiler module.
- Install the Webprofiler module:
- For ECA 2 and later:
- Install the ECA Webprofiler module:
composer require drupal/eca_webprofiler - Enable the ECA Webprofiler module and its dependencies.
- Install the ECA Webprofiler module:
- Go to Administration > Configuration > Development > Devel > Webprofiler
(
/admin/config/development/devel/webprofiler) and enable the ECA toolbar item.
The database logging module is not required when using Webprofiler. There is no need to change the ECA log level either. As soon as ECA is enabled as a toolbar item in the Webprofiler settings, debugging data is collected automatically.
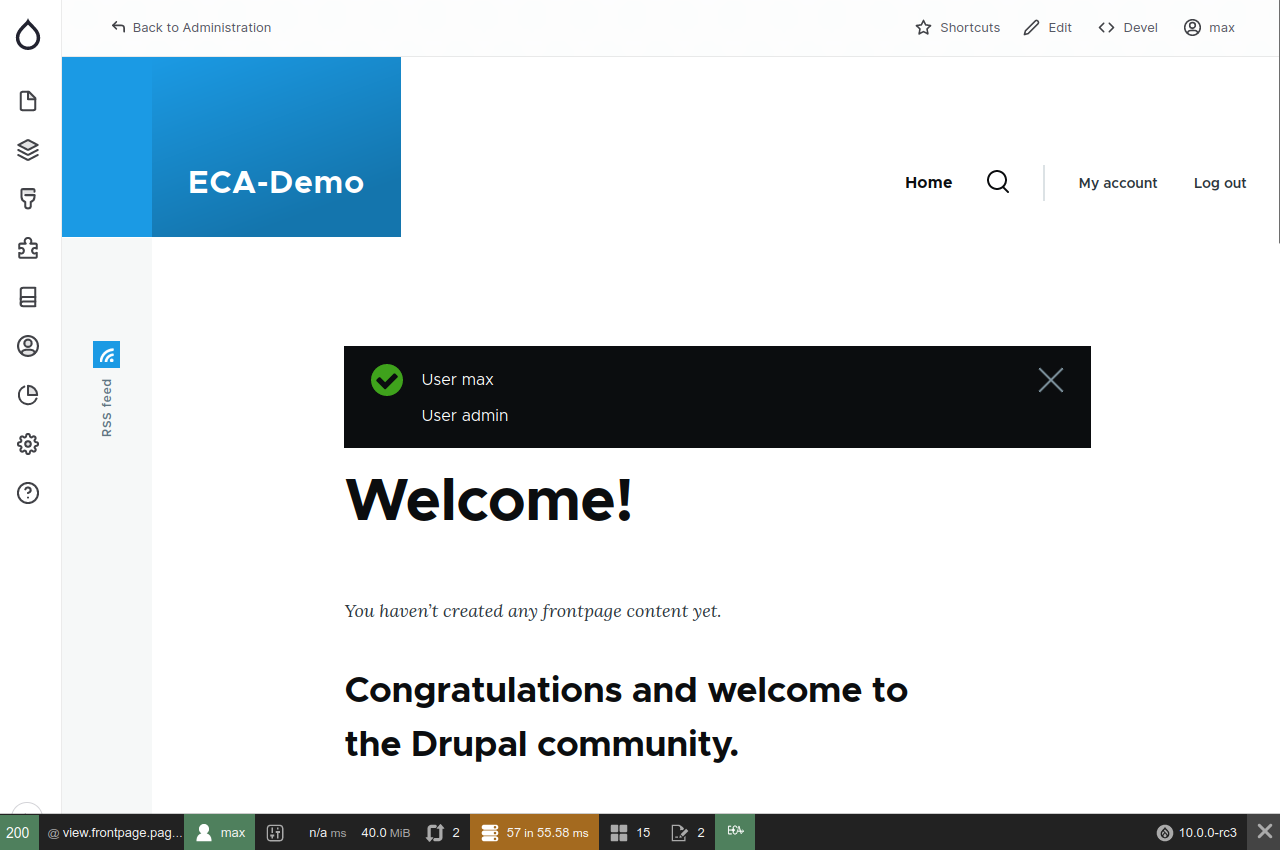
The Webprofiler toolbar appears at the bottom of the screen with information about the latest page request:
Click the ECA icon to open a page with the ECA log messages for that single request:
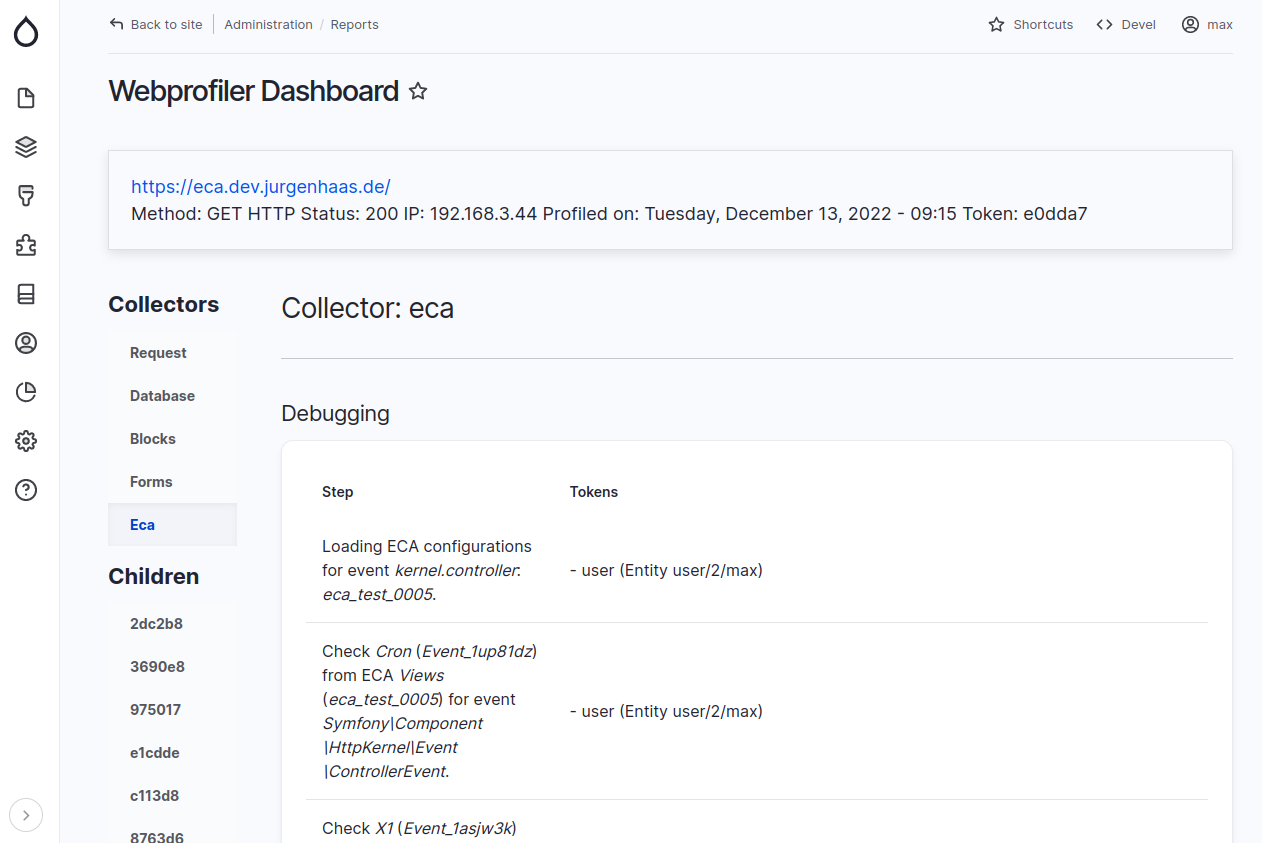
The messages are the same as in database logging, but isolated per request. This makes it much easier to trace ECA processing on pages where multiple models or events are involved.